

Remote Sensing Monitoring of Vegetation Growth Status about Nature Reserves in the Middle of Qinling Mountains
-
摘要: 秦岭地区是中国自然保护区较为集中的地区之一,也是中国重要的生态保护屏障,秦岭中部有多个国家级自然保护区,然而目前鲜有研究分析秦岭中部自然保护区的植被生长状况,且对于自然保护区的保护成效尚不明确,因此探究该区域长时序的植被生长状况有助于了解秦岭地区自然保护区的保护成效及植被生长情况。本文利用Landsat、MODIS、GLASS等遥感数据及相关产品分析了秦岭中部地区14个国家级自然保护区近二三十年归一化植被指数(NDVI)、叶面积指数(LAI)、净初级生产力(NPP)、植被覆盖度(FVC)的空间分布特征及趋势变化情况,并综合4个指标探究秦岭中部自然保护区的植被变化情况与保护成效,研究结果表明,1)在空间上,太白山自然保护区中南部与汉中朱鹮自然保护区南部的植被类型与其他区域存在差异;2)在趋势上,各自然保护区的植被生长状况呈现显著增加趋势或维持稳定状态;3)综合各指标发现,秦岭中部自然保护区的整体保护成效良好,但极个别地区仍需要重点关注。Abstract: The Qinling Mountains is one of the regions with the most intensive nature reserves in China, and it is also an important ecological protection barrier in China. There are many national nature reserves in the middle of the Qinling Mountains, however, there has been few study on the vegetation growth status, and the protection effectiveness of the nature reserves is still unclear. Therefore, exploring the long-term vegetation growth status in this area can be helpful to understand the protection effectiveness and vegetation growth of nature reserves in the middle of the Qinling Mountains. This paper used Landsat, MODIS, GLASS, and other remote sensing data and related products to analyze the spatial distribution characteristics and trend of normalized vegetation index (NDVI), leaf area index (LAI), net primary productivity (NPP), and vegetation coverage (FVC). The comprehensive four indicators were used to explore the vegetation growth status and protection effects of nature reserves in the middle of the Qinling Mountains. The conclusions were as below: 1) In terms of space characteristic, the vegetation types in the south-central Taibai Mountain Nature Reserve and the southern part of the Hanzhong Crested Ibis Nature Reserve was different from others; 2) In terms of trends, the vegetation growth status of nature reserves were in a significant increase trend or maintained stable; 3) Comprehensive the indicators found that the overall protective effect of nature reserves in the middle of Qinling Mountains were good, but very few areas still needed to be focused on.
-

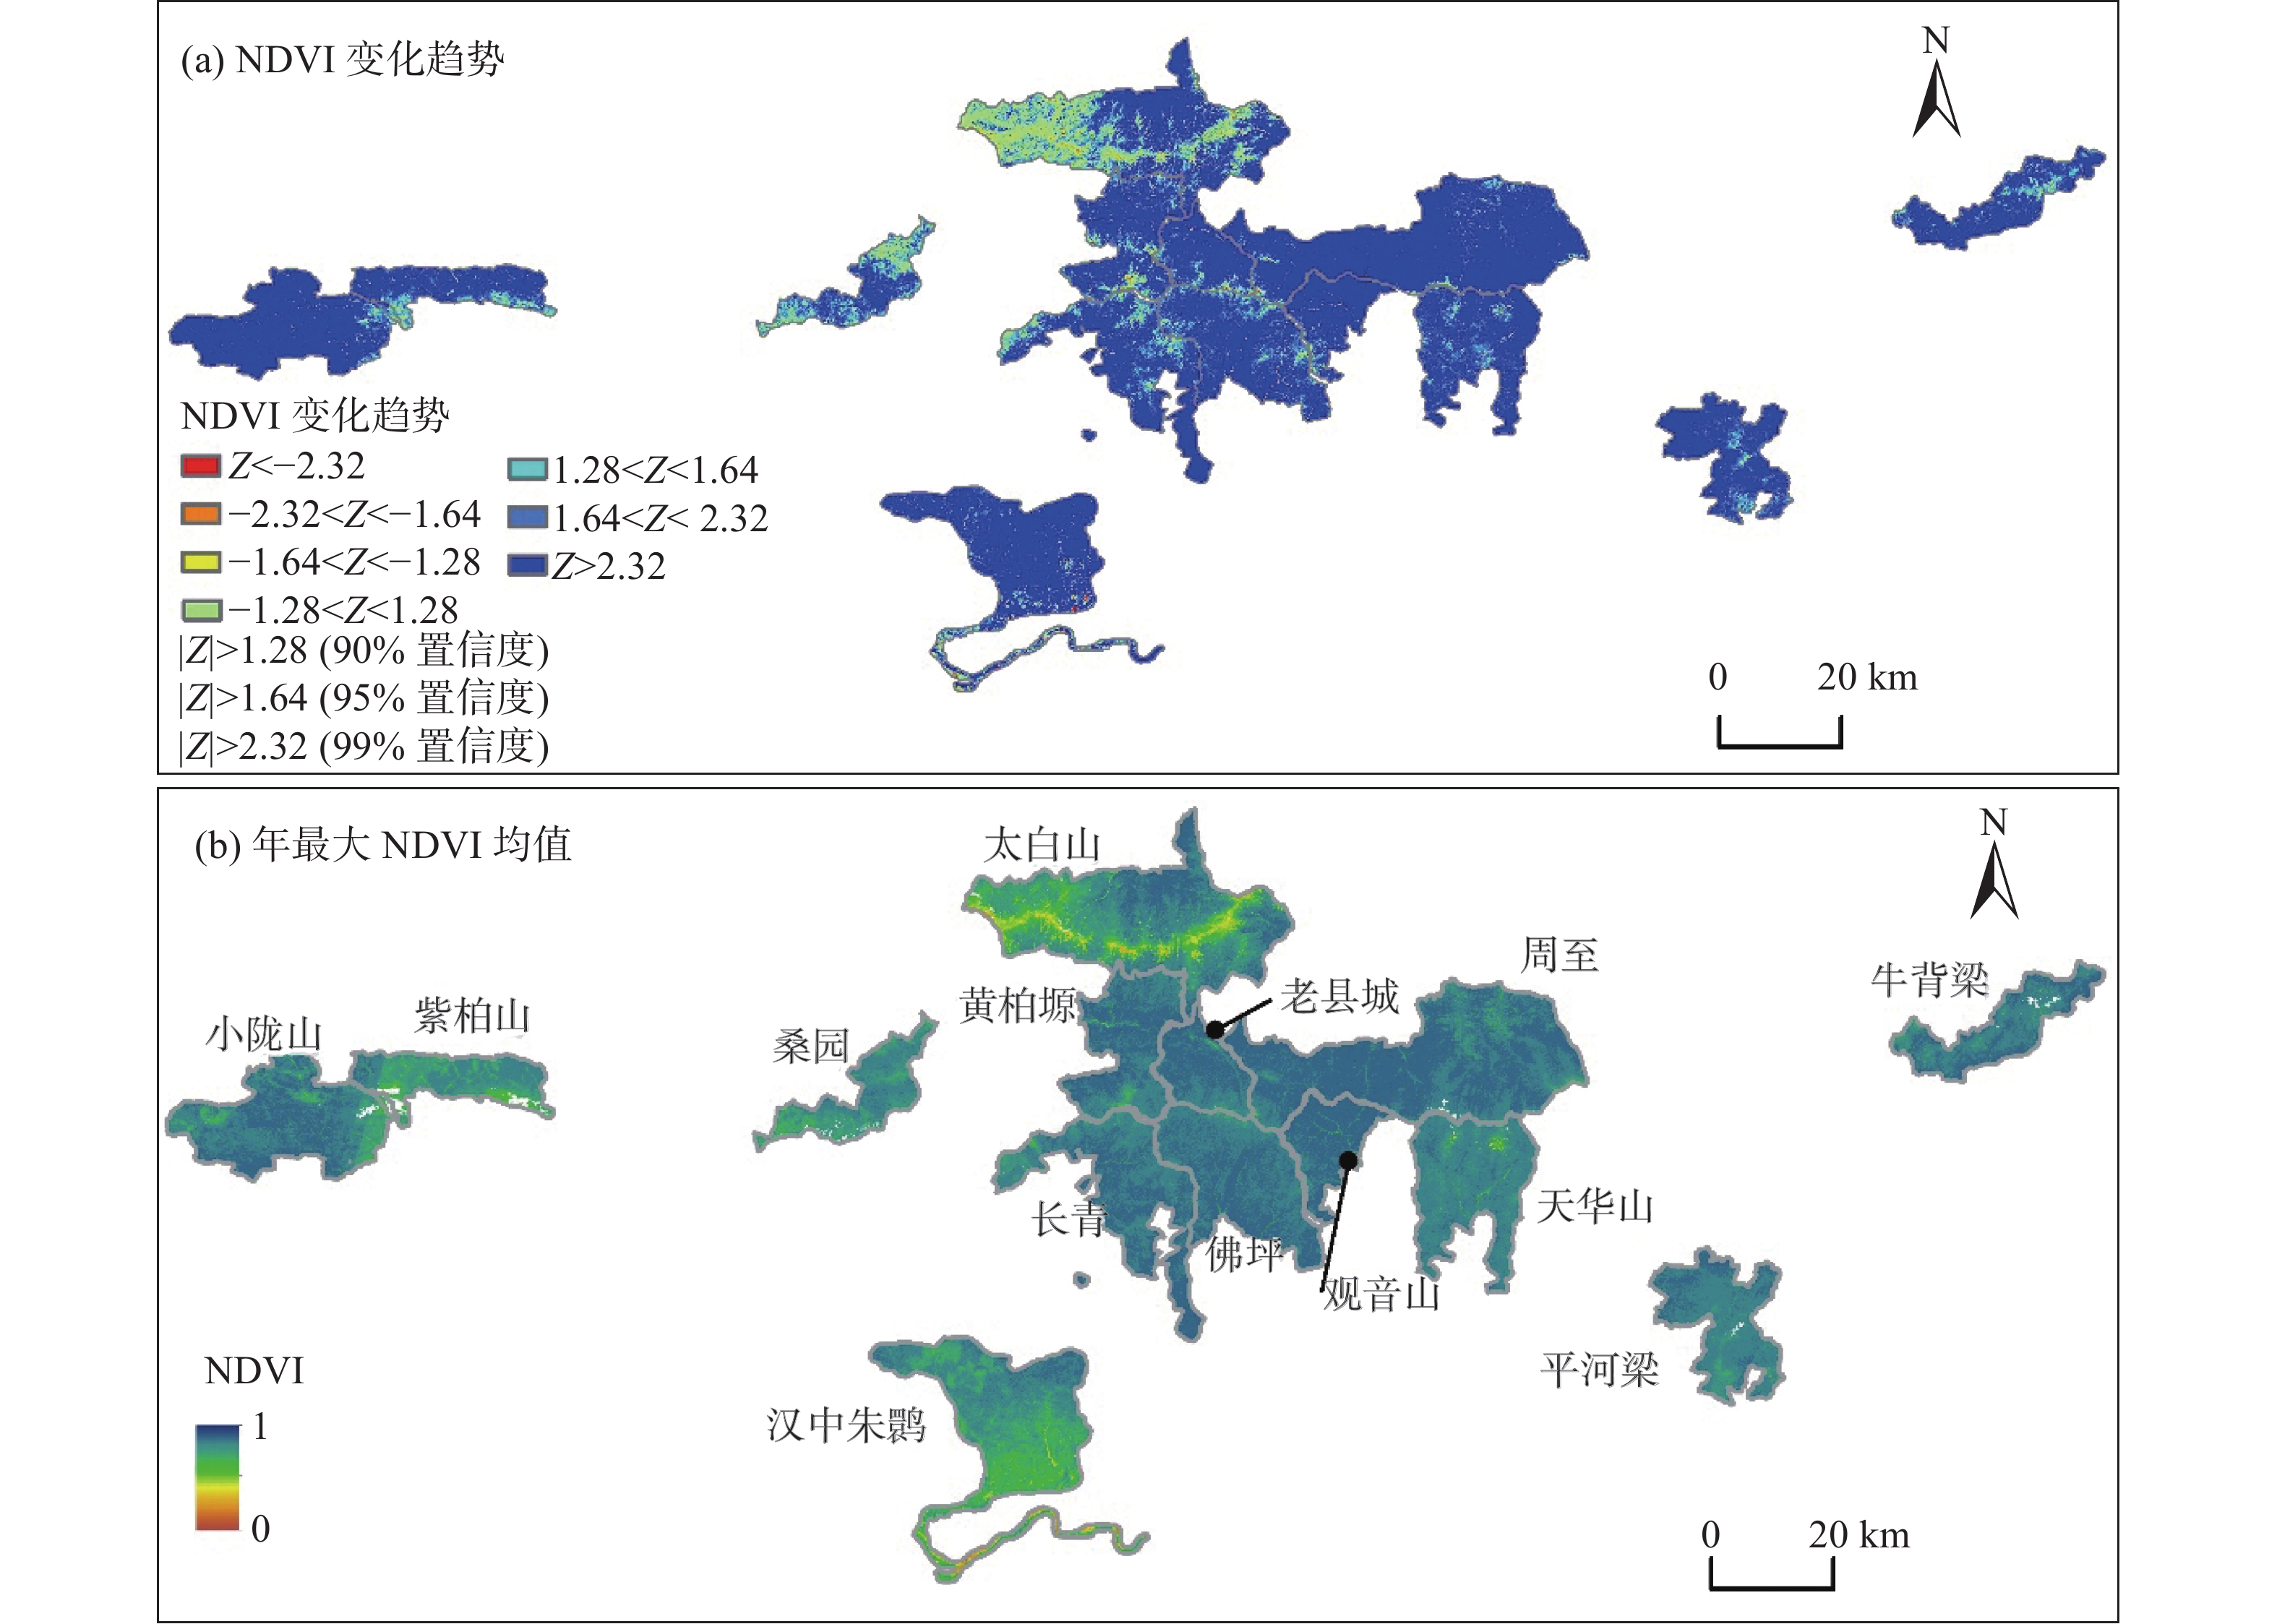
图 2 1986—2019年秦岭中部自然保护区年最大NDVI均值(b)与变化趋势(a)分布
Figure 2. The trend (a) and the average value (b) of annual maximum NDVI in nature reserves in the middle of the Qinling Mountains from 1986 to 2019

图 3 1986—2019年秦岭中部自然保护区年最大NDVI变化情况
Figure 3. Changes in the annual maximum NDVI in nature reserves in the middle of theQinling Mountains from 1986 to 2019

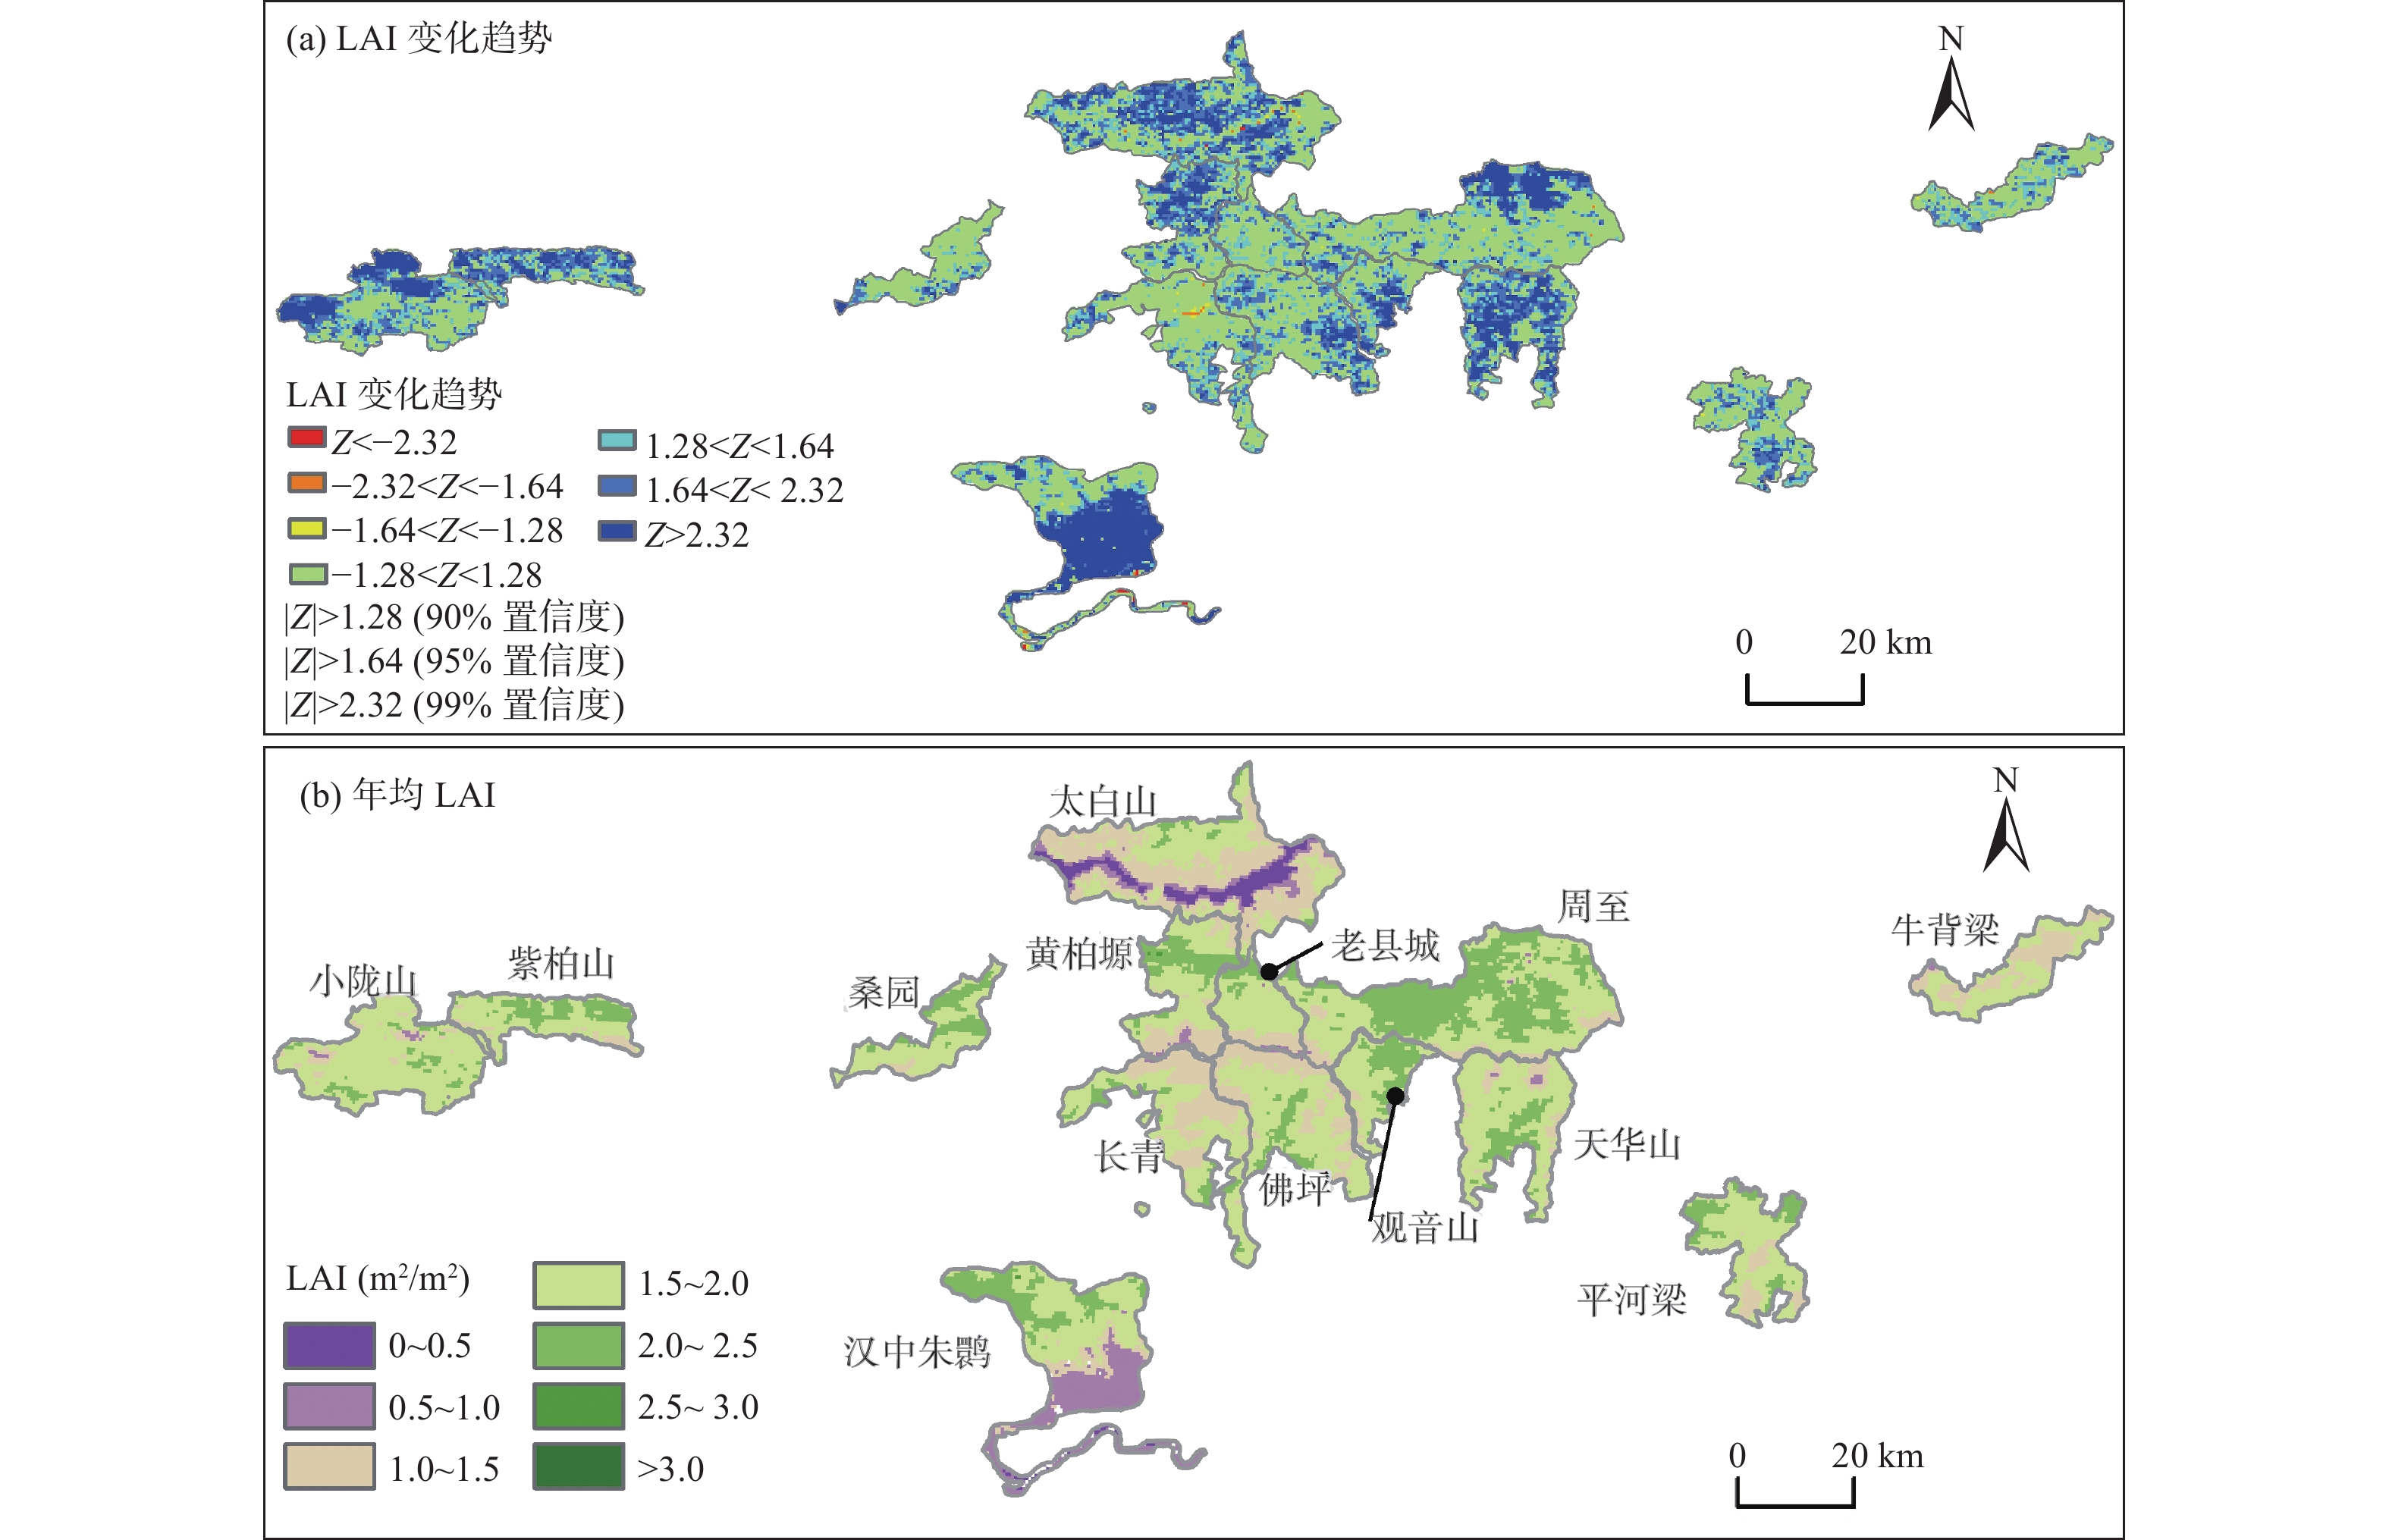
图 4 2000—2019年秦岭中部自然保护区年均LAI均值(b)与变化趋势(a)分布
Figure 4. The trend (a) and the average value (b) of annual average LAI in nature reserves in the middle of the Qinling Mountains from 2000 to 2019

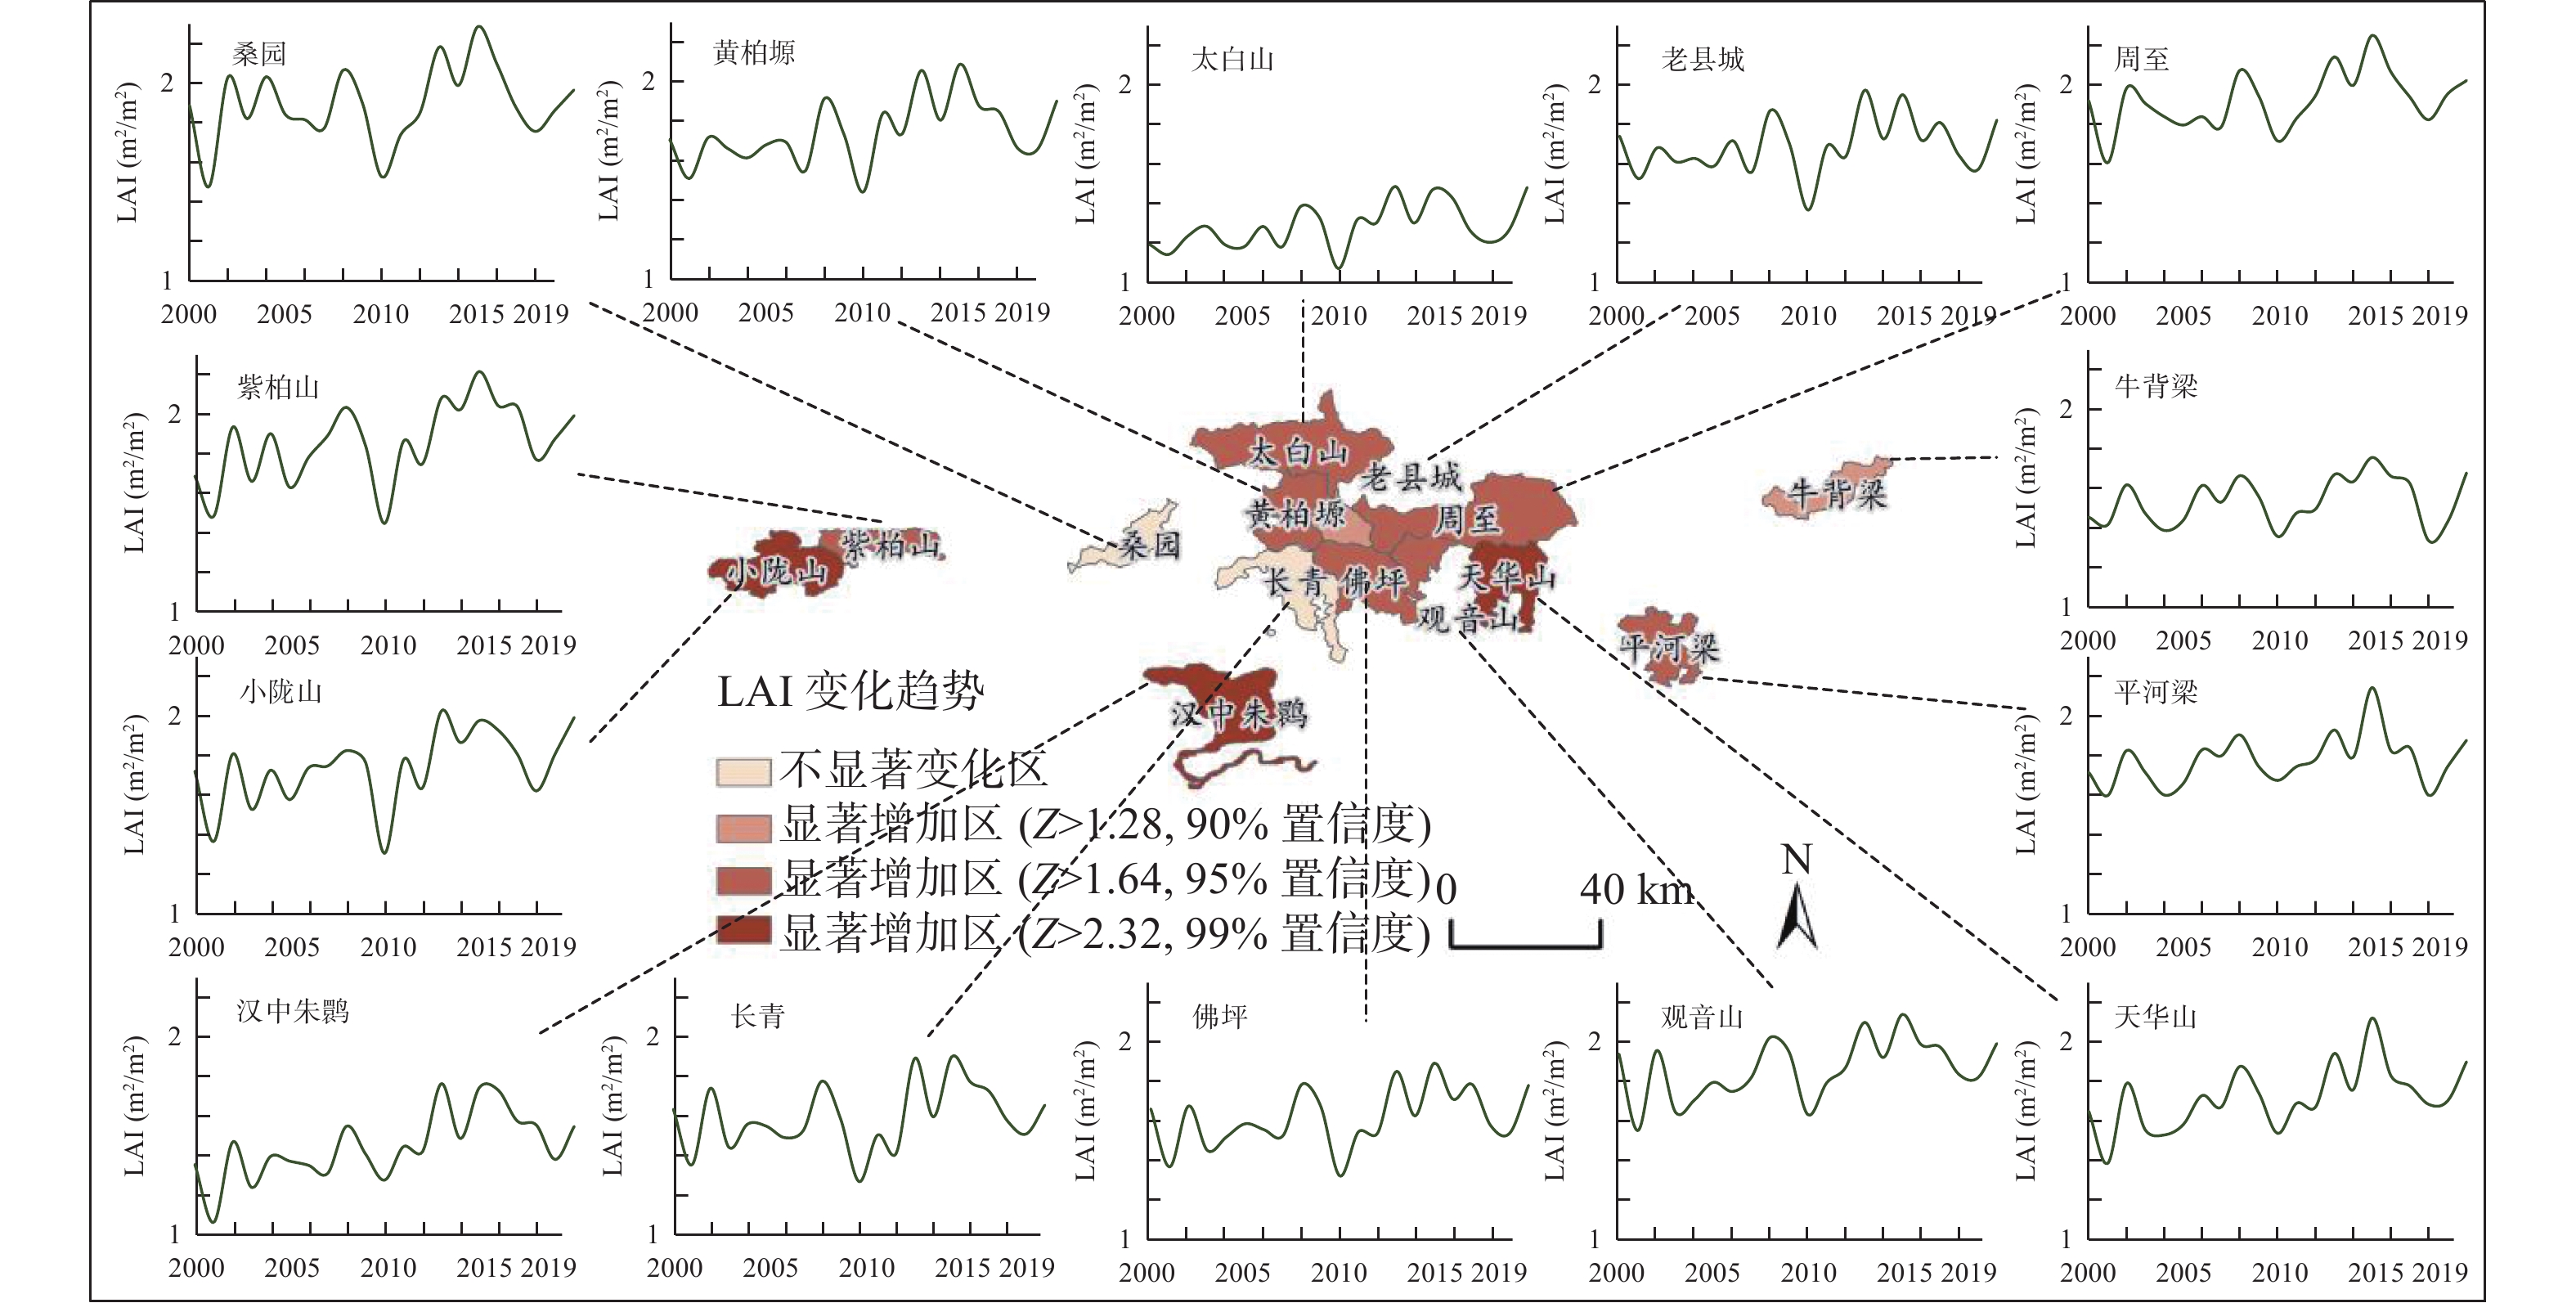
图 5 2000—2019年秦岭中部不同自然保护区年均LAI变化情况
Figure 5. Changes in the annual average LAI in nature reserves in the middle of the Qinling Mountains from 2000 to 2019

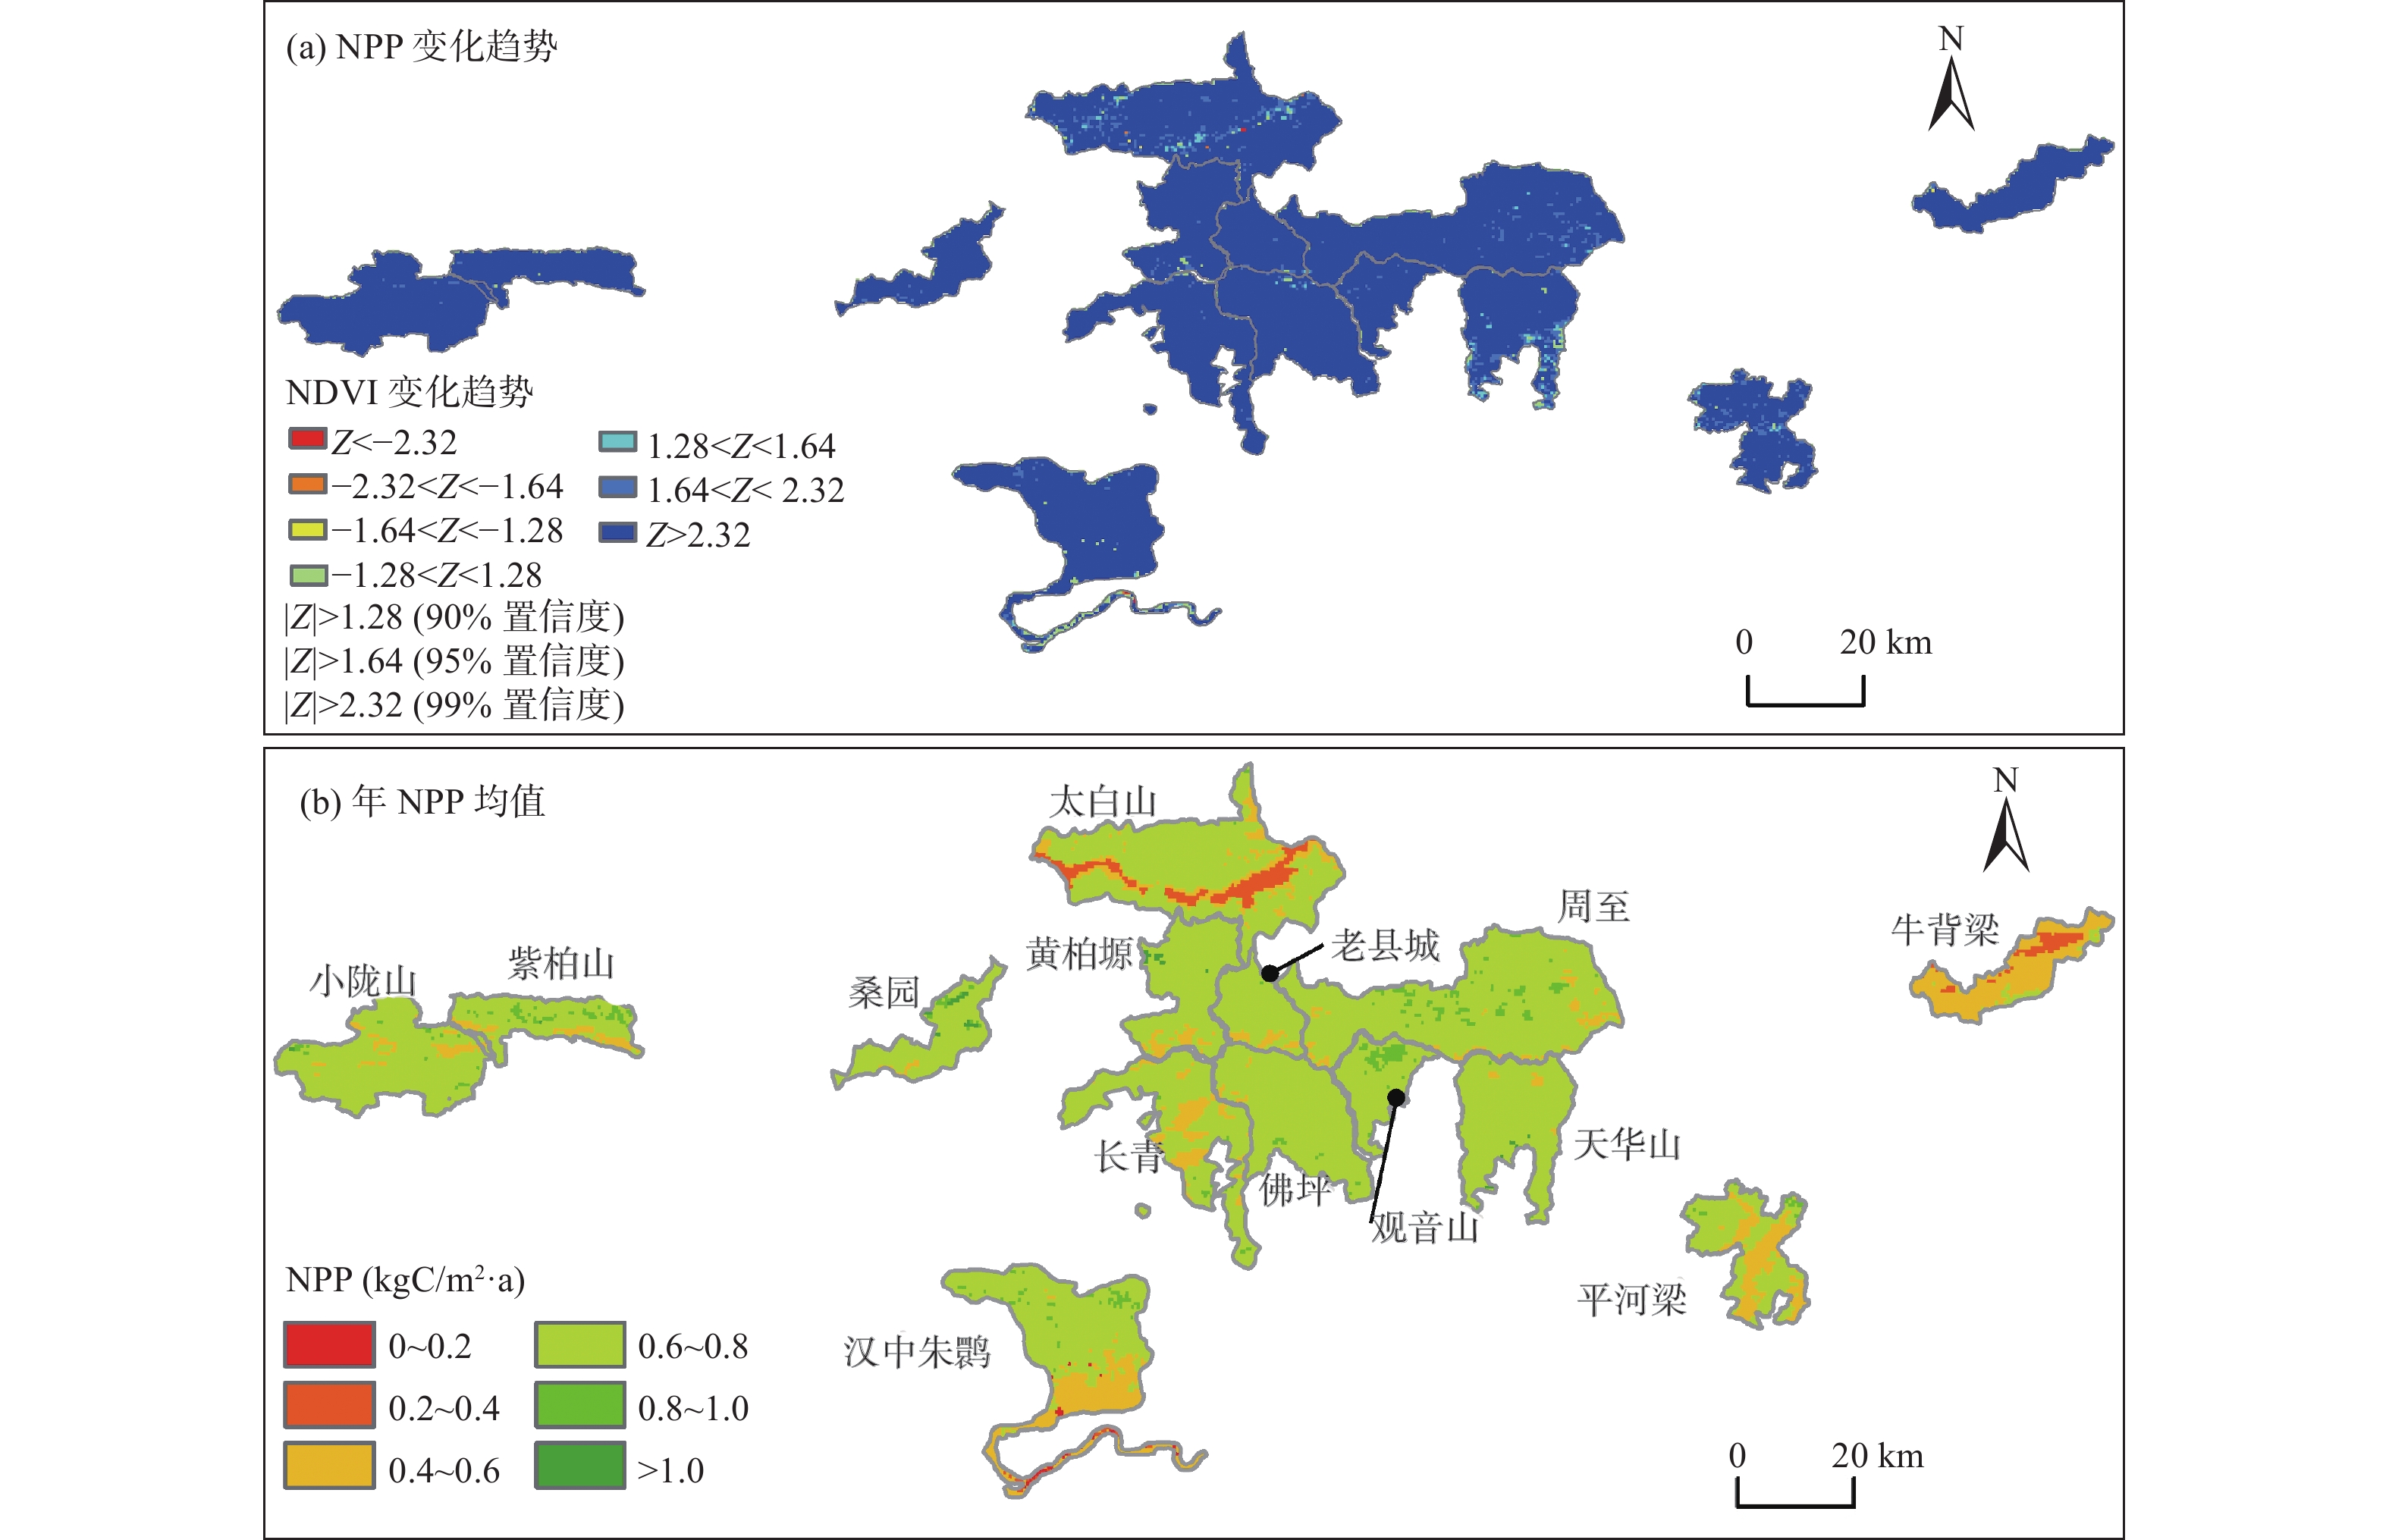
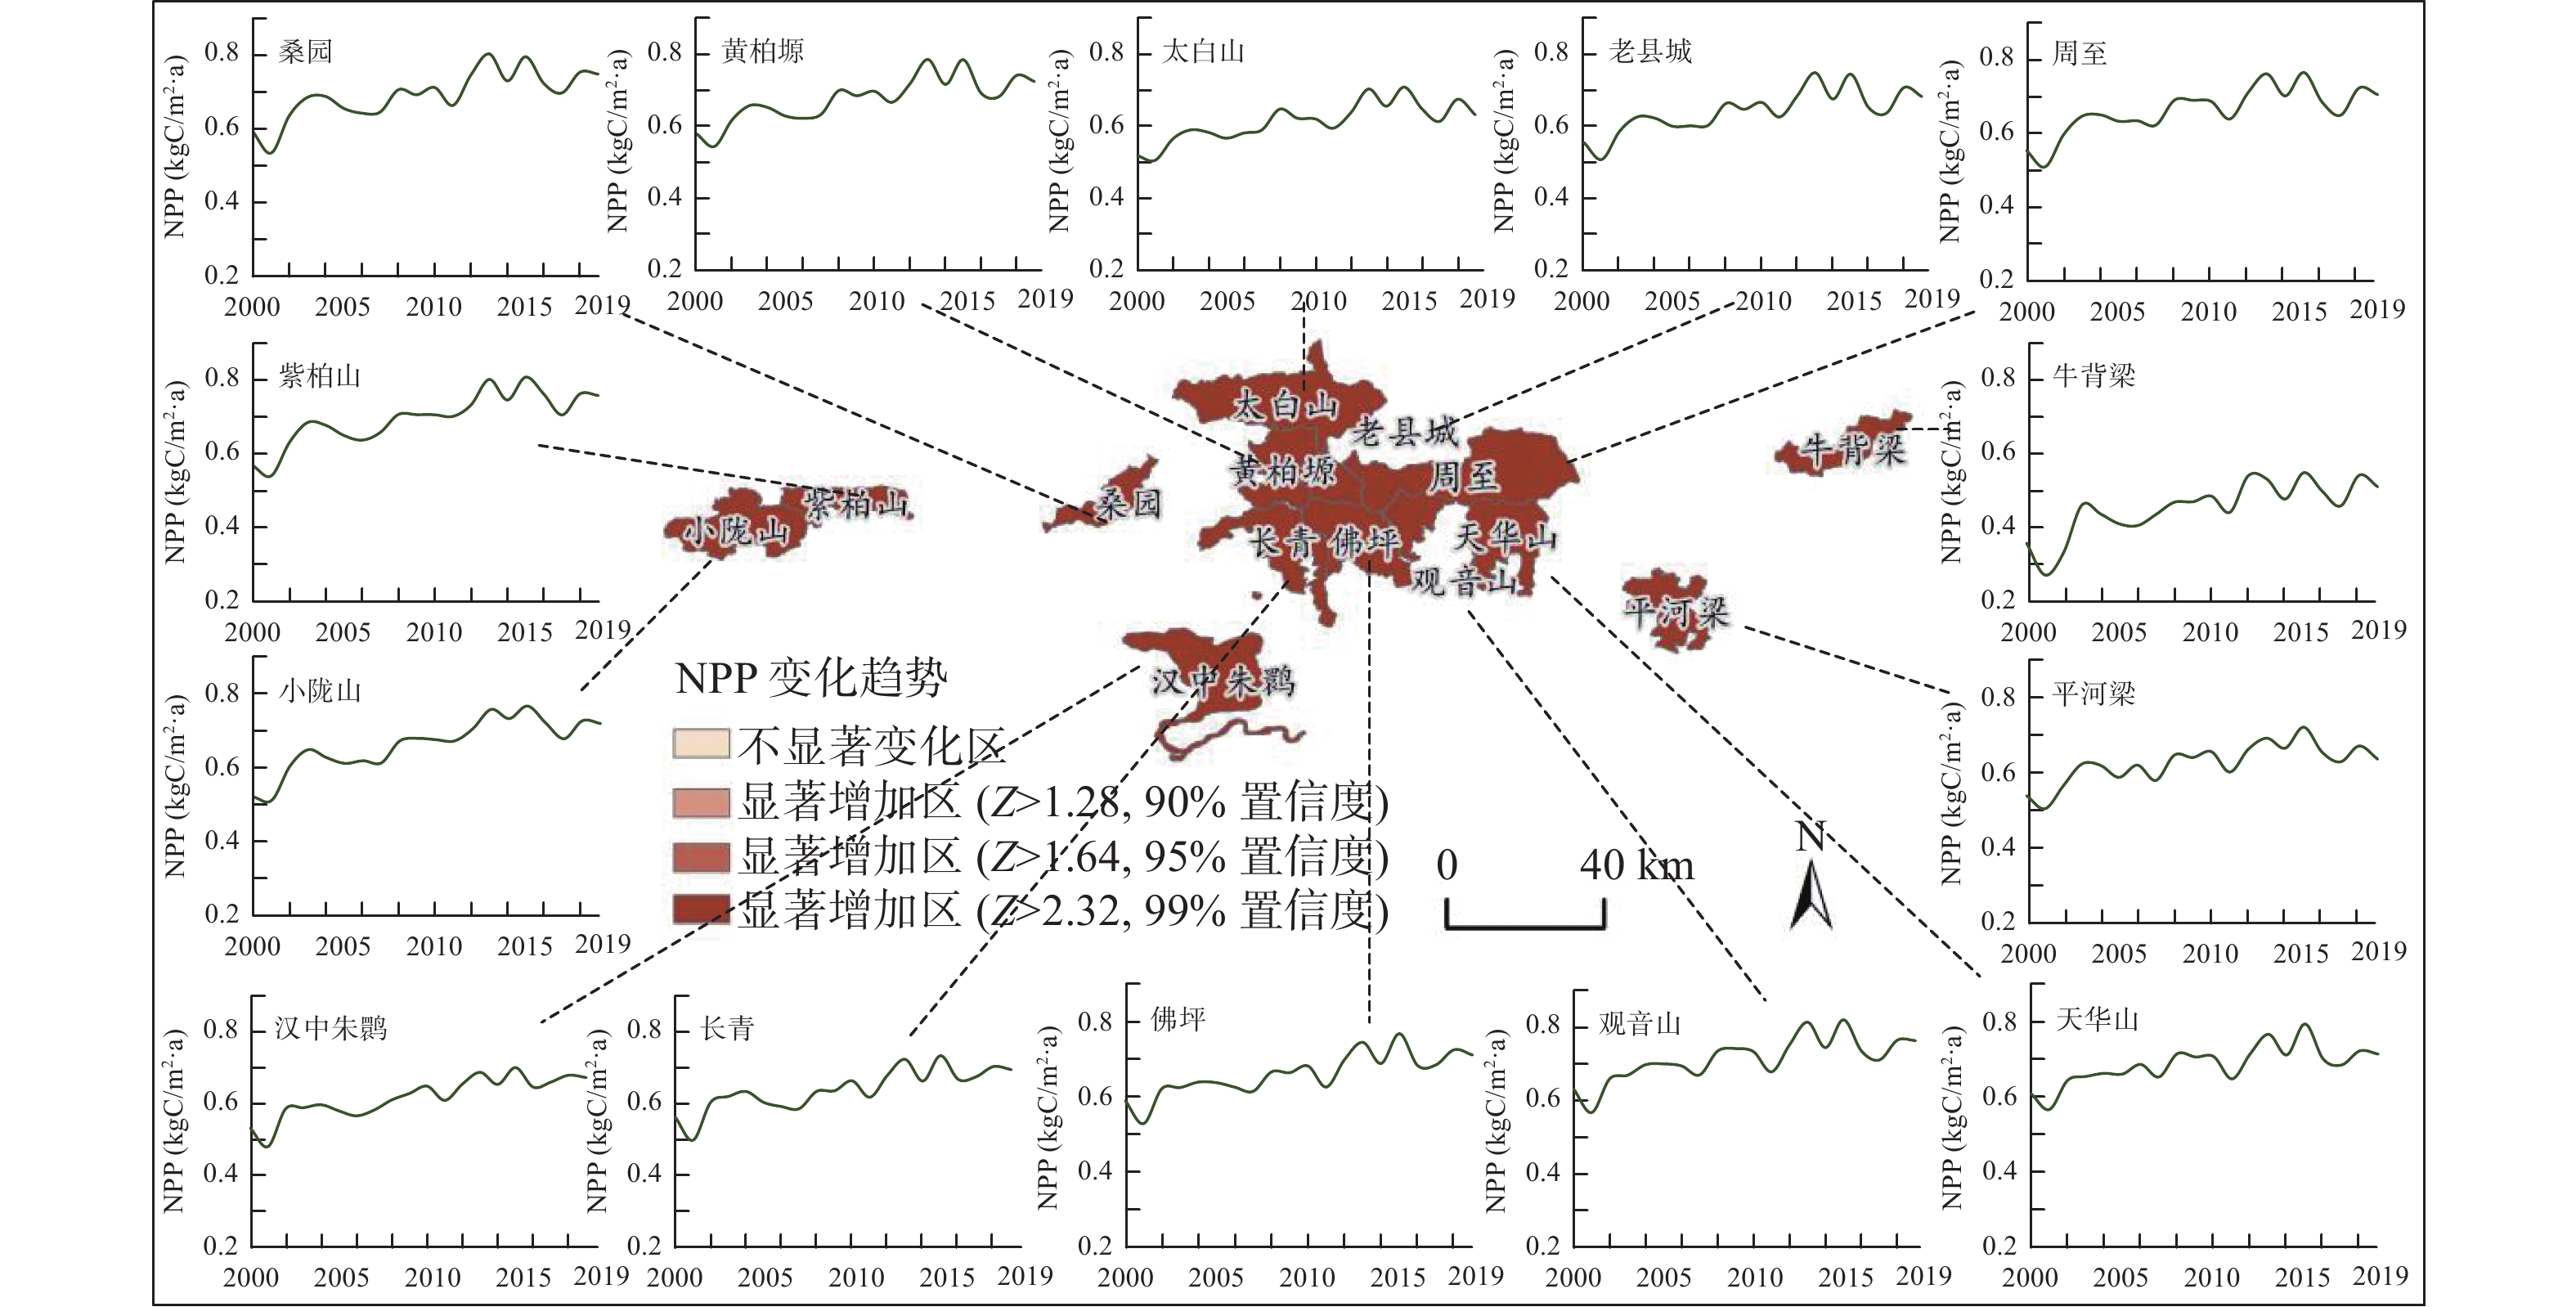
图 6 2000—2019年秦岭中部自然保护区年度NPP均值(b)与变化趋势(a)分布
Figure 6. The trend (a) and the average value (b) of annual NPP in nature reserves in the middle of theQinling Mountains from 2000 to 2019

图 7 2000—2019年秦岭地区不同自然保护区年度NPP变化情况
Figure 7. Changes in the annual NPP in different nature reserves in the Qinling Mountains from 2000 to 2019

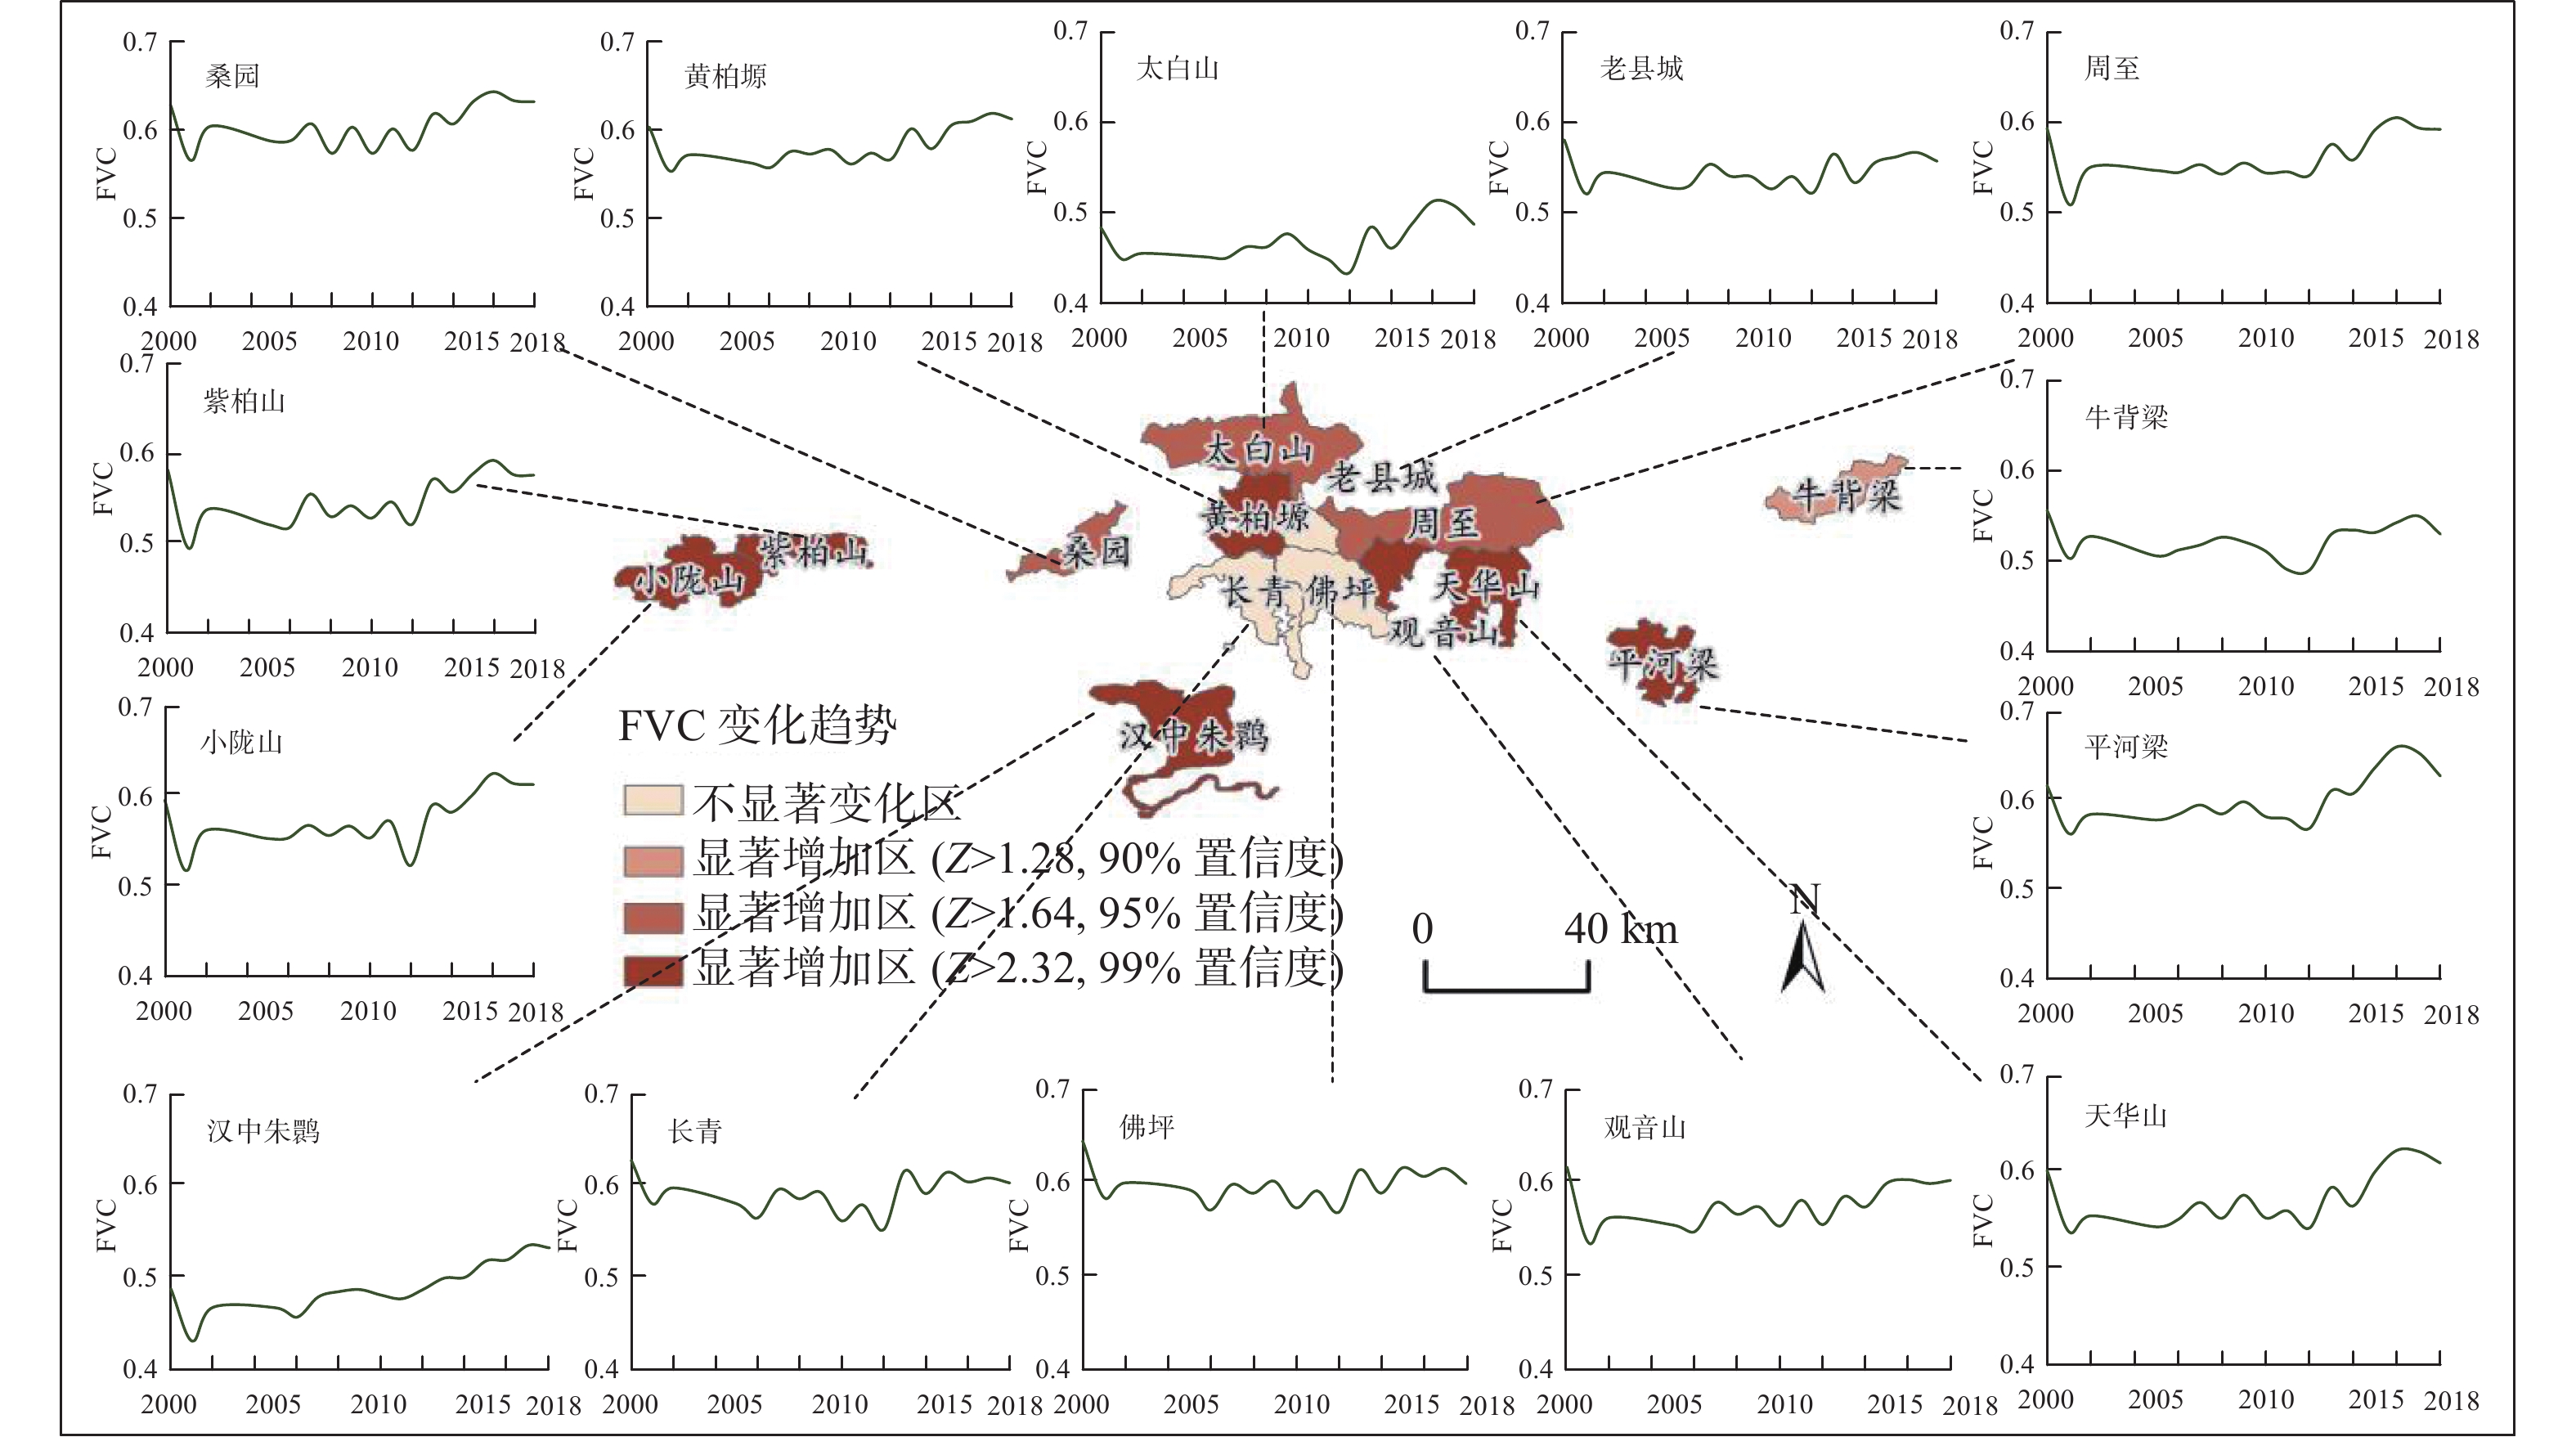
图 8 2000—2018年秦岭中部自然保护区年均FVC均值(b)与变化趋势(a)分布
Figure 8. The trend (a) and the average value (b) of annual average FVC in nature reserves in the middle of the Qinling Mountains from 2000 to 2018

图 9 2000—2018年秦岭中部自然保护区年均FVC变化情况
Figure 9. Changes in the annual average FVC in nature reserves in the middle of theQinling Mountains from 2000 to 2018

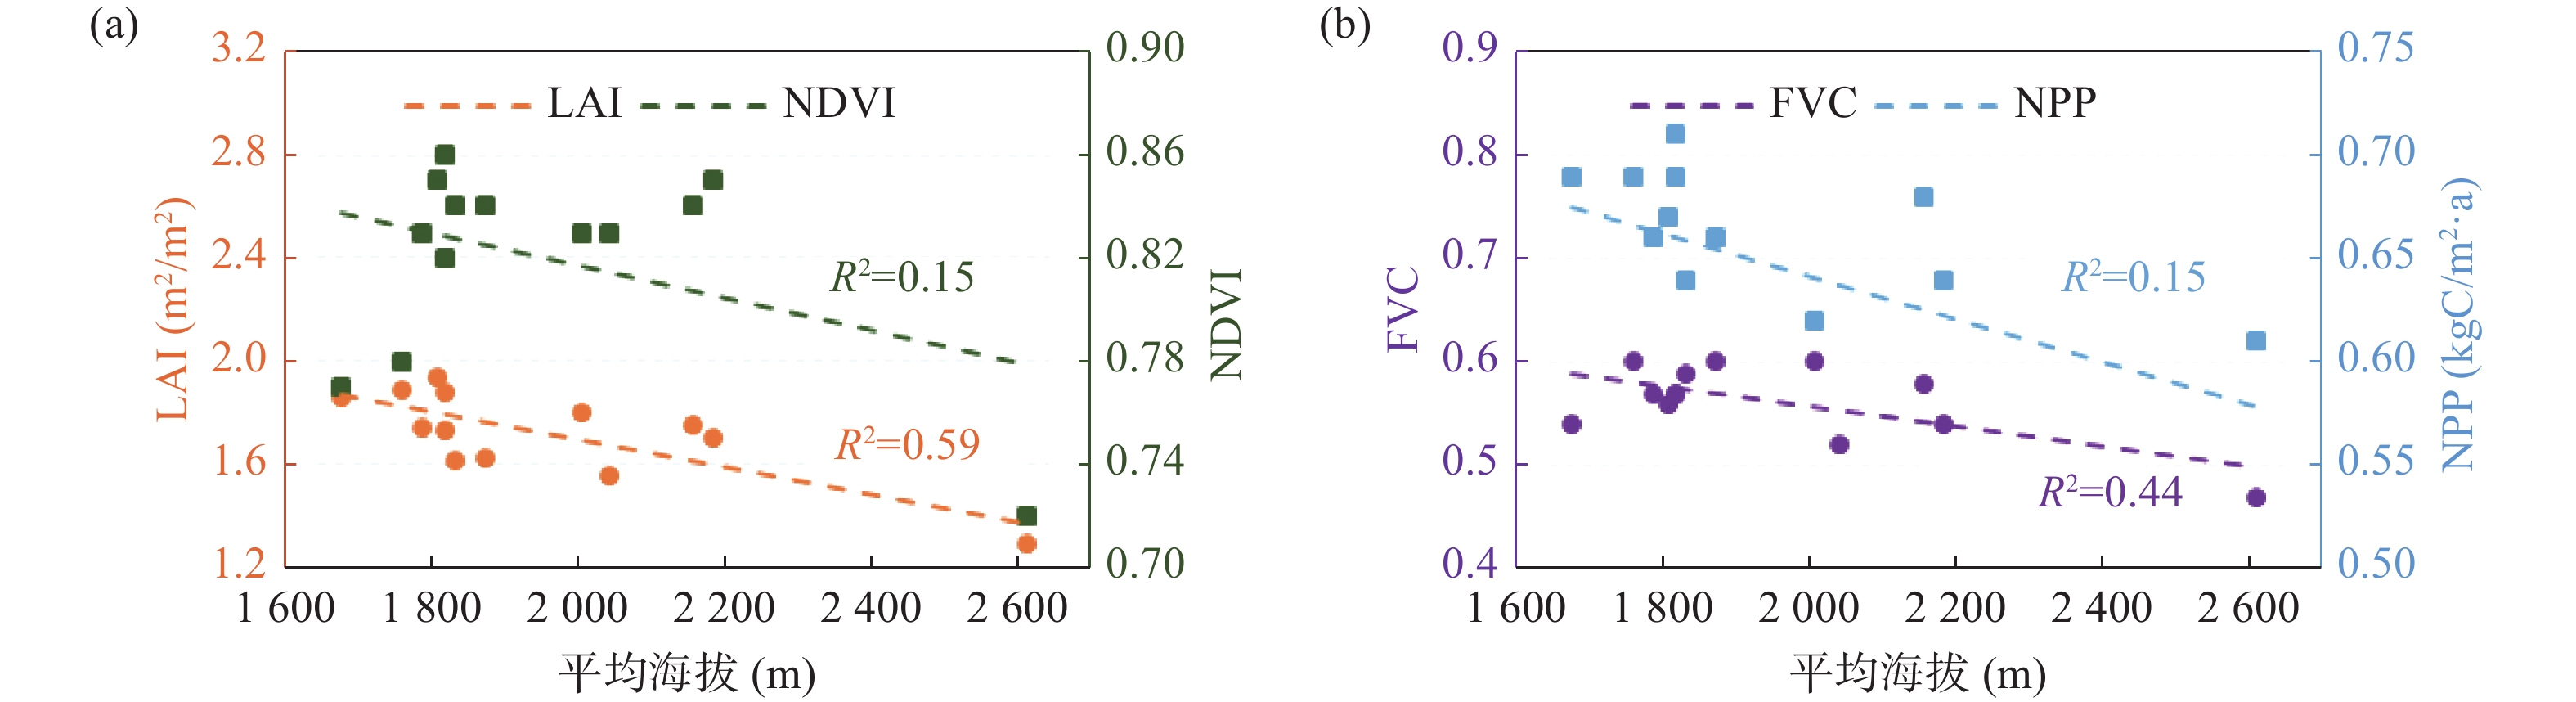
图 10 秦岭中部自然保护区的平均海拔与NDVI、LAI、NPP、FVG均值的关系
Figure 10. The relationship between the mean altitude and the mean value of NDVI, LAI, NPP and FVG in nature reserves in the middle of the Qinling Mountains

图 11 2020年秦岭中部自然保护区土地覆盖分布
Figure 11. Land cover in nature reserves in the middle of the Qinling Mountains in 2020
表 1 秦岭中部自然保护区面积
Table 1. The acreage of nature reserves in the middle of the Qinling Mountains
自然保护区 面积(km2) 等级 省份 自然保护区 面积(km2) 等级 省份 佛坪自然保护区 292.21 国家级 陕西 牛背梁自然保护区 139.25 国家级 陕西 观音山自然保护区 127.40 国家级 陕西 平河梁自然保护区 212.06 国家级 陕西 汉中朱鹮自然保护区 419.91 国家级 陕西 桑园自然保护区 145.31 国家级 陕西 黄柏塬自然保护区 220.39 国家级 陕西 太白山自然保护区 528.43 国家级 陕西 老县城自然保护区 124.21 国家级 陕西 天华山自然保护区 270.68 国家级 陕西 小陇山自然保护区 318.72 国家级 甘肃 周至自然保护区 572.89 国家级 陕西 长青自然保护区 296.98 国家级 陕西 紫柏山自然保护区 162.68 国家级 陕西  下载: 导出CSV
表 2 研究数据说明及来源
Table 2. Introduction to research data
数据指标 年份 分辨率 数据来源 NDVI 1986—2019 30 m 1986—2011年来自Landsat 遥感指数产品( http://databank.casearth.cn )/2013—2019年利用GEE计算得到LAI 2000—2019 500 m MODIS/Terra Leaf Area Index/FPAR 8-Day L4 Global 500 m SIN Grid V061 NPP 2000—2019 500 m MODIS/Terra Net Primary Production Gap-Filled Yearly L4 Global 500m SIN Grid V006 FVC 2000—2018 500 m GLASS产品,国家地球系统科学数据中心( http://www.geodata.cn )LUCC 2020 30 m 2020年全球30米精细地表覆盖产品( http://data.casearth.cn/sdo/detail/5d904b7a0887164a5c7fbfa0 )
下载: 导出CSV
表 3 秦岭中部自然保护区的平均海拔与NDVI、LAI、NPP、FVC的均值
Table 3. The average altitude and the mean value of NDVI, LAI, NPP and FVC in nature reserves in the middle of the Qinling Mountains
保护区 平均海拔(m) NDVI LAI(m2/m2) NPP(kgC/m2·a) FVC 汉中朱鹮 799.3 0.73 1.45 0.62 0.48 紫柏山 1 679.4 0.77 1.86 0.69 0.54 桑园 1 761.9 0.78 1.89 0.69 0.60 小陇山 1 789.0 0.83 1.74 0.66 0.57 周至 1 811.1 0.85 1.94 0.67 0.56 天华山 1 819.7 0.82 1.73 0.69 0.57 观音山 1 820.4 0.86 1.88 0.71 0.57 长青 1 835.4 0.84 1.62 0.64 0.59 佛坪 1 874.7 0.84 1.63 0.66 0.60 平河梁 2 007.8 0.83 1.80 0.62 0.60 牛背梁 2 042.9 0.83 1.56 0.45 0.52 黄柏塬 2 157.0 0.84 1.75 0.68 0.58 老县城 2 186.1 0.85 1.70 0.64 0.54 太白山 2 610.9 0.72 1.29 0.61 0.47
下载: 导出CSV
-
[1] 韩念勇. 中国自然保护区可持续管理政策研究[J]. 自然资源学报, 2000, 15(3): 201−207. doi: 10.3321/j.issn:1000-3037.2000.03.002 [2] 高吉喜, 刘晓曼, 周大庆, 等. 中国自然保护地整合优化关键问题[J]. 生物多样性, 2021, 29(3): 290−294. doi: 10.17520/biods.2021051 [3] 李婷婷, 马超, 郭增长. 2004—2015年贺兰山自然保护区植被NPP时空变化与气候响应[J]. 水土保持研究, 2020, 27(6): 254−261. [4] 张园, 袁凤辉, 王安志, 等. 2001—2018年长白山自然保护区生长季NDVI变化特征及其对气候变化的响应[J]. 应用生态学报, 2020, 31(4): 1213−1222. [5] 杜军, 牛晓俊, 袁雷, 等. 1971—2017年羌塘国家级自然保护区陆地生态环境变化[J]. 冰川冻土, 2020, 42(3): 1017−1026. [6] 曹明, 李俊生, 王伟, 等. 秦岭国家级自然保护区水源涵养服务保护成效评估[J]. 生物多样性, 2021, 29(5): 617−628. doi: 10.17520/biods.2020271 [7] 张百平, 余付勤, 王晶, 等. 西秦岭自然保护的地位与意义[J]. 自然保护地, 2021, 1(2): 31−37. doi: 10.12335/2096-8981.2021012101 [8] 盛任, 万鲁河. 乌伊岭国家级自然保护区植被覆盖演变及其对气候突变的响应[J]. 生态学报, 2019, 39(9): 3243−3256. [9] 张建亮, 刘方正, 崔国发. 长白山国家级自然保护区植被时空变化及其驱动因子[J]. 生态学报, 2016, 36(12): 3525−3536. [10] 闫峰, 吴波, 王艳姣. 2000—2011年毛乌素沙地植被生长状况时空变化特征[J]. 地理科学, 2013, 33(5): 602−608. [11] 方精云, 朴世龙, 贺金生, 等. 近20年来中国植被活动在增强[J]. 中国科学(C辑:生命科学), 2003, 33(6): 554−565,578-579. [12] Deering D W. Rangeland Reflectance Characteristics Measured by Aircraft and Spacecraft Sensors[D]. Card City: Texas A&M University, 1978. [13] Chen J M, Cihlar J. Retrieving Leaf area Index of Boreal Conifer Forests Using Landsat TM Images[J]. Remote Sensing of Environment, 1996, 55(2): 153−162. doi: 10.1016/0034-4257(95)00195-6 [14] 方秀琴, 张万昌. 叶面积指数(LAI)的遥感定量方法综述[J]. 国土资源遥感, 2003, 15(3): 58−62. [15] 浦瑞良, 宫鹏. 高光谱遥感及其应用[M]. 北京: 高等教育出版社, 2000. [16] 朱文泉, 潘耀忠, 张锦水. 中国陆地植被净初级生产力遥感估算[J]. 植物生态学报, 2007, 31(3): 413−424. doi: 10.3321/j.issn:1005-264X.2007.03.010 [17] Field C B, Behrenfeld M J, Randerson J T, et al. Primary Production of the Biosphere: Integrating Terrestrial and Oceanic Components[J]. Science, 1998, 281(5374): 237−240. doi: 10.1126/science.281.5374.237 [18] Gitelson A A, Kaufman Y J, Stark R, et al. Novel Algorithms for Remote Estimation of Vegetation Fraction[J]. Remote Sensing of Environment, 2002, 80(1): 76−87. doi: 10.1016/S0034-4257(01)00289-9 [19] 贾坤, 姚云军, 魏香琴, 等. 植被覆盖度遥感估算研究进展[J]. 地球科学进展, 2013, 28(7): 774−782. doi: 10.11867/j.issn.1001-8166.2013.07.0774 [20] 张建云, 章四龙, 王金星, 等. 近50年来中国六大流域年际径流变化趋势研究[J]. 水科学进展, 2007, 18(2): 230−234. doi: 10.3321/j.issn:1001-6791.2007.02.013 [21] 余付勤, 张百平, 王晶, 等. 国外大尺度生态廊道保护进展与秦岭国家公园建设[J]. 自然资源学报, 2021, 36(10): 2478−2490. -


 点击查看大图

计量
- 文章访问数: 512
- HTML全文浏览量: 255
- PDF下载量: 281
- 被引次数: 0

 邮件订阅
邮件订阅 Rss
Rss